
Data Observability
The need to monitor the pipelines and processes in data-processing and analytics environments has driven the emergence of a new category of software: data observability.
Data observability software provides an environment for monitoring the quality and reliability of data used for analytics and governance projects.
Inspired by the observability platforms that provide an environment for monitoring metrics, traces and logs to track application and infrastructure performance, data observability software provides an environment for monitoring the quality and reliability of data used for analytics and governance projects.
There has been a Cambrian explosion of data observability software vendors in recent years and while each is slightly different, they also have fundamental capabilities in common. To monitor and measure anything, it must first be instrumented, so a baseline requirement for data observability software is that it collects and measures metrics from data pipelines, data warehouses, data lakes and other data-processing platforms.
Data observability software also collects, monitors and measures information on data lineage (dependencies between data), metadata (describing the attributes of the data, such as its age, volume, format, schema), and logs of human- or machine-based interaction with the data. In addition to collecting and monitoring this information, some data observability software also enables the creation of models that can be applied to the various metrics, logs, dependencies and attributes to automate the detection of anomalies.
Data observability software may also offer root cause analysis and the provision of alerts, explanations and recommendations to enable data engineers and data architects to accelerate the correction of issues.
Data observability addresses one of the most significant impediments to generating value from data. Maintaining data quality and trust is a perennial data management challenge, often preventing organizations from operating at the speed of business. Almost two-thirds (64%) of participants in Ventana Research’s Analytics and Data Benchmark Research cite reviewing data for quality and consistency issues as the most time-consuming task in analyzing data.
As organizations aspire to be more data-driven, it is critical to trust the data used to make those decisions.
The importance of trust in data has arguably never been greater. As organizations aspire to be more data-driven, it is critical to trust the data used to make those decisions. Without data quality processes and tools, organizations may make decisions based on old, incomplete, incorrect or poorly organized data. Assessing the quality of data used to make business decisions is not only more important than ever but also increasingly difficult given the growing range of data sources and the volume of data that needs to be evaluated. Poor data quality processes can result in security and privacy risks as well as unnecessary data storage and processing costs due to data duplication.
Monitoring the quality and reliability of data used for analytics and governance projects is not a new challenge. Data quality software has been extant for decades. Organizations that have made investments in data quality might reasonably ask whether they need data observability, while those that have invested in data observability might wonder whether they can eschew traditional data quality tools.
To understand the difference between data quality and data observability it is important to recognize data quality is both a discipline and a product category. As a discipline, data quality refers to the processes, methods and tools used to measure the suitability of a dataset for a specific purpose. The precise measure of suitability will depend on the individual use case, but important characteristics include accuracy, completeness, consistency, timeliness and validity. The data quality product category is comprised of the tools used to evaluate data in relation to these characteristics.
Data observability, meanwhile, has emerged as a separate product category. It includes software focused on automating the monitoring of data to assess its health based on key attributes including freshness, distribution, volume, schema and lineage.
The use of automation expands the volume of data that can be monitored while also improving efficiency compared to manual data monitoring and management by automating data quality checks and recommended remediation actions. As such, automation is often cited as a distinction between data observability and data quality software. Focusing on automation as a distinction, however, relies on an outdated view of data quality software.
Although data quality software has historically provided users with an environment to manually check and correct data quality issues, the use of machine learning (ML) to automate the monitoring of data is also being integrated into data quality tools and platforms. Automating data monitoring ensures it is complete, valid and consistent as well as relevant and free from duplication. Automation using ML is not, therefore, a defining characteristic that separates data quality from data observability.
A clearer distinction can be drawn from the scope and focus of the functionality. Data quality software is concerned with the suitability of the data to a given task. In comparison, data observability is concerned with the reliability and health of the overall data environment.
Data observability tools monitor not just the data in an individual environment for a specific purpose at a given point in time, but also the associated upstream and downstream data pipelines.
Data observability tools monitor not just the data in an individual environment for a specific purpose at a given point in time, but also the associated upstream and downstream data pipelines. In doing so, data observability software ensures that data is available and up to date, avoiding downtime caused by lost or inaccurate data due to schema changes, system failures or broken data pipelines.
To put it another way, while data quality software is designed to help users identify and resolve data quality problems, data observability software is designed to automate the detection and identification of the causes of data quality problems, potentially enabling users to prevent data quality issues before they occur.
The two are largely complementary. For example, when the data being assessed remains consistent, data quality tools might not detect a failed pipeline until the data has become out of date. Data observability tools could detect the failure long before the data quality issue arises. Conversely, a change in address might not be identified by data observability tools if the new information adhered to the correct schema. It could be detected — and remediated — using data quality tools.
The reciprocal nature of data quality and data observability software products is supported by the fact that some vendors offer products in both categories while others offer products that could be said to offer functionality associated with both data observability and data quality. In addition to the emergence of standalone data observability software specialists, we also see this functionality being included in wider DataOps platforms. This is a trend we expect to continue. Through 2025, data observability will continue to be a priority for the evolution of data operations products as vendors deliver more automated approaches to data engineering and improving trust in enterprise data.
The relative immaturity of the market for data observability software means that it is difficult for organizations today to evaluate potential suppliers.
The relative immaturity of the market for data observability software means that it is difficult for organizations today to evaluate potential suppliers. Only a handful of vendors met the inclusion criteria for this Buyer’s Guide, while there is a very long list of Vendors of Note that were considered. Many of the emerging vendors are likely to be acquired while a few will fall by the wayside. That should not stop organizations from evaluating the potential benefits of data observability, however. It has a critical role to play in evaluating the performance and reliability of data pipelines, as well as the quality and validity of data, to deliver the benefits of investment in data and analytics.
The evolution of data observability is still in its early stages. Potential adopters of data observability are advised to pay close attention and evaluate purchases carefully. Some data observability products offer quality resolution and remediation functionality traditionally associated with data quality software, albeit not to the same depth and breadth. Additionally, some vendors previously associated with data quality have adopted the term data observability but may lack the depth and breadth of pipeline monitoring and error detection capabilities.
This research evaluates the following vendors that offer products that address key elements of data observability as we define it: Acceldata, Collibra, DataKitchen, IBM, Monte Carlo, Precisely and Stonebranch.
Buyers Guide Overview
For over two decades, Ventana Research has conducted market research in a spectrum of areas across business applications, tools and technologies. Ventana Research has designed the Buyers Guide to provide a balanced perspective of vendors and products that is rooted in an understanding of the business requirement in any organization. Utilization of our research methodology and decades of experience enables our Buyers Guide to be an effective method to assess and select technology vendors and products. The findings of this research undertaking contribute to our comprehensive approach to rating vendors in a manner that is based on the assessments completed by an organization.
Ventana Research has designed the Buyers Guide to provide a balanced perspective of vendors and products that is rooted in an understanding of business requirements in any organization.
This Ventana Research Buyers Guide: Data Observability is the distillation of over a year of market and product research efforts. It is an assessment of how well vendors’ offerings will address organizations requirements for data observability software. The index is structured to support a request for information (RFI) that could be used in the RFP process by incorporating all criteria needed to evaluate, select, utilize and maintain relationships with technology vendors. An effective product and customer experience with a technology vendor can ensure the best long-term relationship and value achieved from a resource and financial investment.
In this Buyers Guide, Ventana Research evaluates the software in seven key categories that are weighted to reflect buyers’ needs based on our expertise and research. Five are product-experience related: Adaptability, Capability, Manageability, Reliability, and Usability. In addition, we consider two customer-experience categories: Validation, and Total Cost of Ownership and Return on Investment (TCO/ROI). To assess functionality, one of the components of capability, we applied the Ventana Research Value Index methodology and blueprint, which links the personas and processes for data observability to an organization’s requirements.
The structure of the research reflects our understanding that the effective evaluation of vendors and products involves far more than just examining product features, potential revenue or customers generated from a vendor’s marketing and sales efforts. We believe it is important to take a comprehensive research-based approach, since making the wrong choice of a data observability technology can raise the total cost of ownership, lower the return on investment and hamper an organization’s ability to reach its potential performance. In addition, this approach can reduce the project’s development and deployment time and eliminate the risk of relying on a short list of vendors that does not represent a best fit for your organization.
Ventana Research believes that an objective review of vendors and products is a critical business strategy for the adoption and implementation of software.
To ensure the accuracy of the information we collected, we asked participating vendors to provide product and company information across the seven product and customer experience categories that, taken together, reflect the concerns of a well-crafted RFI. Ventana Research then validated the information, first independently through our database of product information and extensive web-based research, and then in consultation with the vendors. Most selected vendors also participated in a one-on-one session providing an overview and demonstration, after which we requested they provide additional documentation to support any new input.
Ventana Research believes that an objective review of vendors and products is a critical business strategy for the adoption and implementation of data observability software and applications. An organization’s review should include a thorough analysis of both what is possible and what is relevant. We urge organizations to do a thorough job of evaluating data observability systems and tools and offer this Buyers Guide as both the results of our in-depth analysis of these vendors and as an evaluation methodology.
How To Use This Buyers Guide
Evaluating Vendors: The Process
We recommend using the Buyers Guide to assess and evaluate new or existing technology vendors for your organization. The market research can be used as an evaluation framework to establish a formal request for information from technology vendors on their products and customer experience and will shorten the cycle time when creating a RFI. The steps listed below provide a process that can facilitate best possible outcomes.
- Define the business case and goals.
Define the mission and business case for investment and the expected outcomes from your organizational and technology efforts. - Specify the business needs.
Defining the business requirements helps identify what specific capabilities are required with respect to people, processes, information and technology. - Assess the required roles and responsibilities.
Identify the individuals required for success at every level of the organization from executives to front line workers and determine the needs of each. - Outline the project’s critical path.
What needs to be done, in what order and who will do it? This outline should make clear the prior dependencies at each step of the project plan. - Ascertain the technology approach.
Determine the business and technology approach that most closely aligns to your organization’s requirements. - Establish technology vendor evaluation criteria.
Utilize the product experience: Adaptability, Capability, Manageability, Reliability and Usability, and the customer experience in TCO/ROI and Validation. - Evaluate and select the technology properly.
Weight the categories in the technology evaluation criteria to reflect your organization’s priorities to determine the short list of vendors and products. - Establish the business initiative team to start the project.
Identify who will lead the project and the members of the team needed to plan and execute it with timelines, priorities and resources.
The Findings
All of the products we evaluated are feature-rich, but not all the capabilities offered by a technology vendor are equally valuable to types of workers or support everything needed to manage products on a continuous basis. Moreover, the existence of too many capabilities may be a negative factor for an organization if it introduces unnecessary complexity. Nonetheless, you may decide that a larger number of features in the product is a plus, especially if some of them match your organization’s established practices or support an initiative that is driving the purchase of new software.
Factors beyond features and functions or vendor assessments may become a deciding factor. For example, an organization may face budget constraints such that the TCO evaluation can tip the balance to one vendor or another. This is where the Value Index methodology and the appropriate category weighting can be applied to determine the best fit of vendors and products to your specific needs.
Overall Scoring of Vendors Across Categories
The research finds Monte Carlo atop the list, followed by IBM and Acceldata. Companies that place in the top three of a category earn the designation of Leader. IBM and Monte Carlo have done so in all of the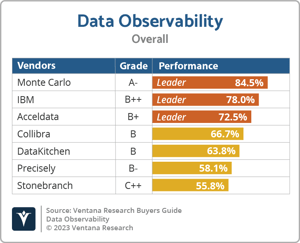 seven categories; Acceldata in four; Collibra in two and Precisely in one category.
The overall representation of the research below places the rating of the Product Experience and Customer Experience on the x and y axes, respectively, to provide a visual representation and classification of the vendors. Those vendors whose Product Experience have a higher weighted performance to the axis in aggregate of the five product categories place farther to the right, while the performance and weighting for the two Customer Experience categories determines their placement on the vertical axis. In short, vendors that place closer to the upper-right on this chart performed better than those closer to the lower-left.
The research places vendors into one of four overall categories: Assurance, Exemplary, Merit or Innovative. This representation classifies vendors overall weighted performance.
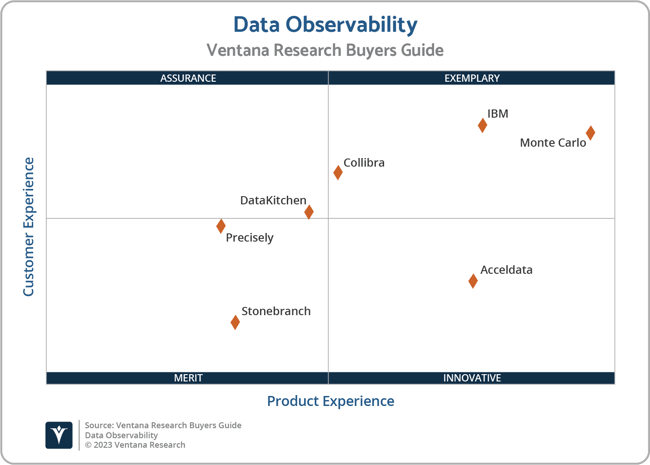
Exemplary: The categorization and placement of vendors in Exemplary (upper right) represent those that performed the best in meeting the overall Product and Customer Experience requirements. The vendors awarded Exemplary are: Collibra, IBM and Monte Carlo.
Innovative: The categorization and placement of vendors in Innovative (lower right) represent those that performed the best in meeting the overall Product Experience requirements but did not achieve the highest levels of requirements in Customer Experience. The vendor awarded Innovative is: Acceldata.
Assurance: The categorization and placement of vendors in Assurance (upper left) represent those that achieved the highest levels in the overall Customer Experience requirements but did not achieve the highest levels of Product Experience. The vendor awarded Assurance is: DataKitchen.
Merit: The categorization for vendors in Merit (lower left) represent those that did not exceed the median of performance in Customer or Product Experience or surpass the threshold for the other three categories. The vendors awarded Merit are: Precisely and Stonebranch.
We warn that close vendor placement proximity should not be taken to imply that the packages evaluated are functionally identical or equally well suited for use by every organization or for a specific process. Although there is a high degree of commonality in how organizations handle data observability, there are many idiosyncrasies and differences in how they do these functions that can make one vendor’s offering a better fit than another’s for a particular organization’s needs.
We advise organizations to assess and evaluate vendors based on their requirements and use this research as a reference to their own evaluation of a vendor and products.
Product Experience
The process of researching products to address an organization’s needs should be comprehensive. Our Value Index methodology examines Product Experience and how it aligns with an organization’s life cycle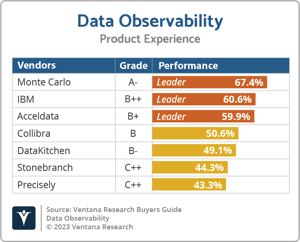 of onboarding, configuration, operations, usage and maintenance. Too often, vendors are not evaluated for the entirety of the products; instead, they are evaluated on market execution and vision of the future, which are flawed since they do not represent an organization’s requirements but how the vendor operates. As more vendors orient to a complete product experience, the more robust of an evaluation can be conducted.
The research based on the methodology of expertise identified the weighting of Product Experience to 80% or four-fifths of the overall rating. Importance was placed on the categories as follows: Usability (20%), Capability (25%), Reliability (10%), Adaptability (15%) and Manageability (10%). This weighting impacted the resulting overall ratings in this research. Monte Carlo, IBM and Acceldata were designated Product Experience Leaders as a result of their top-ranked weighted performance. Collibra also performed well, particularly in relation to Adaptability.
Many organizations will only evaluate capabilities for those in IT or administration, but the research identified the criticality of Usability (20% weighting) across a broader set of usage personas that should participate in data observability.
Capability of the Product
The Capability criteria is designed to assess the products and features across a broad range of data observability capabilities that support enterprise, commerce, supplier, consumer, and business-to-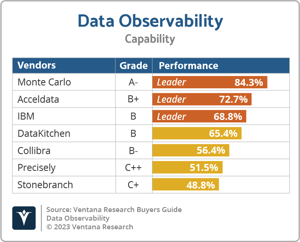 business requirements. In addition, the criteria for the detection, resolution and prevention of data reliability issues is assessed using industry standards. The Capability support for management, manager, analyst, administrative and IT personas was also assessed.
Ventana Research evaluates more than 90 different function points in five sections to assess the full scope of data observability capabilities. It also examines the investment by the vendor in resources and improvements.
The research weights Capability at 25% of the overall rating. Monte Carlo, Acceldata and IBM are the top three Leaders in this category. Monte Carlo received a grade of A-, Acceldata a B+ and IBM a B. Five of the seven vendors were under 70% of performance, demonstrating the significant separation of sophistication amongst the vendors and products.
The significant, in-depth Capability evaluation framework for data observability provides a more substantive challenge for many vendors. The research largely focuses on how vendors apply data observability and the specific processes where some specialize, such as the detection of data reliability issues, compared to resolution and prevention. Vendors that have more breadth and depth and support the entire set of needs fared better than others. Vendors who specialize in the detection of data reliability issues did not perform as well as the others. The specialization of data observability and the capabilities for business is found across the majority of vendors, giving organizations a significant choice on the products they use for their organization.
Reliability of the Product
For data observability processes to operate efficiently and for workers to engage the applications, the software on which they run must reliably deliver the necessary performance and scalability using the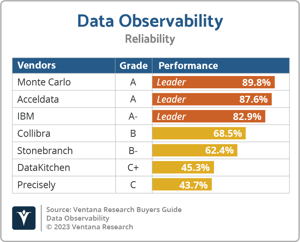 existing architecture operating across the enterprise and cloud computing environments. The criteria include depth in the performance and scalability of a vendor’s products and architecture, including the metrics to ensure operations and configurability across data, users, instances, activities and tasks. It also examines the investment by the vendor in resources and improvements.
The research weights Reliability at 10% of the overall rating. Monte Carlo, Acceldata and IBM are the top three Leaders in this category, providing the highest level of confidence that they can operate at any level of reliability 24 hours a day. Monte Carlo and Acceldata received an A grade, and IBM an A-.
Reliability is an essential evaluation metric as it indicates the product’s ability to perform and scale to the defined enterprise requirements and how well it supports the continuous processing required for business continuity and operational resilience today and into the future.
Evaluating the performance and scalability readiness of data observability software is not always easy, though, as it depends on the type of product information and the volume at which it is being updated and used by processes and systems. Some of the vendors we evaluated lack the readiness to provide this level of information at any depth, though it is necessary to establish the confidence required for a vendor selection.
Customer Experience
The importance of a customer relationship with a vendor is essential to the actual success of the products and technology. The advancement of the Customer Experience and the entire life cycle an organization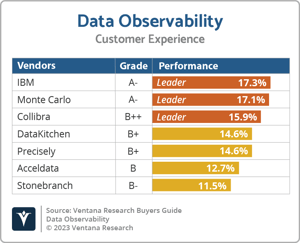 has with its vendor is critical for ensuring satisfaction in working with that vendor. Technology providers that have Chief Customer Officers area more likely to have greater investments in the customer relationship and focus more on their success. These leaders also need to take responsibility for ensuring the marketing of their commitment is made abundantly clear on website and in the buying process and customer journey.
Our Value Index methodology weights Customer Experience at 20% of the overall rating, or one-fifth, as it relates to the framework of commitment and value to the vendor-customer relationship. The two evaluation categories are Validation (10%) and TCO/ROI (10%), which are weighted to represent their importance to the overall research.
The vendors that evaluated the highest overall in the aggregated and weighted Customer Experience categories are IBM, Monte Carlo and Collibra, with IBM and Monte Carlo receiving A- grades and Collibra receiving a B++. These category leaders in Customer Experience best communicate their commitment and dedication to customer needs.
Several vendors we evaluated did not have sufficient information available through their website and presentations. While many have customer case studies to promote their success, some lack depth on their commitment to an organizations’ journey to data observability. This makes it difficult for organizations to evaluate vendors on the merits of their commitment to customer success. As a result, some of the vendors’ performances evaluated lower. As the commitment to a vendor is a continuous investment, the importance of supporting customer experience in a holistic evaluation should be included and not underestimated.
TCO/ROI of the Vendor
The TCO/ROI category applies evaluation criteria designed to assess how effective the vendor is in demonstrating the business case, including the products strategic value, total cost of ownership and total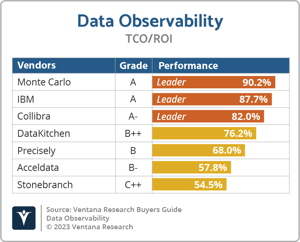 benefit of ownership. The criteria also include an evaluation of the tools and documentation it provides to enable customer evaluation of TCO and ROI, and what the vendor cites as its investment and services to support it. It also examines the investment by the vendor in resources and improvements.
The research weights TCO/ROI at 10% of the overall rating. Monte Carlo, IBM and Collibra are Leaders in this category, with Monte Carlo and IBM receiving an A grade and Collibra receiving an A-.
TCO/ROI is an essential evaluation metric when determining a vendor’s commitment to the customer experience and that the value and costs associated are related to deployment and adoption of the vendor’s product in the most efficient manner possible. A technology vendor should also demonstrate its ability to support an organization’s opportunity to achieve its current and future goals.
A small number of vendors evaluated quite well in this category providing buyers and customers with TCO/ROI-related support so they in turn can effectively help with the business case and get funding for data observability investment. However, our analysis found that some vendors struggle significantly to make available the tools and documented information needed for organizations to make a sound buying decision. Those vendors with lower than A grades in this Buyers Guide also have limited information on their website to support the information related to TCO/ROI, which is needed to evaluate and select a vendor for data observability.
Monte Carlo
Company and Product Profile
Monte Carlo Data Observability Platform, Version June 30, released June 2023
“Data breaks. Monte Carlo ensures your team is the first to know and solve with end-to-end data observability. Data quality monitoring and alerting across your entire data platform, from ingestion in the warehouse to the business intelligence layer. We’ve got you covered.” – Monte Carlo
Summary
Our analysis classified Monte Carlo as Exemplary, receiving an overall grade of A- with an 84.5% performance. Monte Carlo’s best grouped results came in Customer Experience at 85.3% performance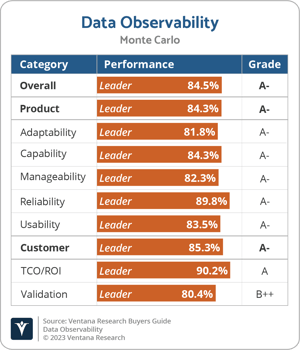 and an A- grade due in part to its A in TCO/ROI. In Product Experience, Monte Carlo received an A- grade with an 84.3% performance due to its 89.8% performance in Reliability. Monte Carlo was designated a Leader in all categories of this evaluation.
Monte Carlo fully participated in the RFI process.
Challenges
Monte Carlo’s A- grade in Product Experience was nominally impacted by its A- in Adaptability where it could enhance process integration. Customer Experience was impacted by its B++ grade in Validation where it could provide more information related to sales and onboarding.
Strengths
Monte Carlo performed best in Customer Experience with an A- grade, notably in TCO/ROI, receiving an A due to its articulation of strategic values and tools to help customers calculate costs. In Usability, intelligence and user experience are strengths. Monte Carlo’s technology architecture and operations and scalability led to its A- grade in Reliability.
Appendix: Vendor Inclusion
For inclusion in the Ventana Research Data Observability Buyers Guide for 2023, a vendor must be in good standing financially and ethically, have at least $10 million in annual or projected revenue verified using independent sources, or have at least 75 employees, and sell products and provide support on at least two continents. The principal source of the relevant business unit’s revenue must be software-related and there must have been at least one major software release in the last 18 months. The vendor must provide a product that supports agile and collaborative data operations and is marketing themselves or products as one of the following: a DataOps tool or platform; a data orchestration tool or platform; a data observability tool or platform. The research is designed to be independent of the specifics of vendor packaging and pricing. To represent the real-world environment in which businesses operate, we include vendors that offer suites or packages of products that may include relevant individual modules or applications. If a vendor is actively marketing, selling and developing a product for the general market and is reflected on its website that it is within the scope of the research, that vendor is automatically evaluated for inclusion.
All vendors that offer relevant data observability products and meet the inclusion requirements were invited to participate in the research evaluation process at no cost to them.
Two of the 7 vendors responded positively to our requests for additional information and provided completed questionnaires and demonstrations to help in our evaluation of their data observability products. We categorize participation as follows:
Complete participation: The following vendors actively participated and provided completed questionnaires and demonstrations to help in our evaluation of their product: Acceldata and Monte Carlo.
Partial participation: The following vendor provided limited information to help in our evaluation: DataKitchen.
No participation: The following vendors provided no information or did not respond to our request: Collibra, IBM, Precisely and Stonebranch.
Vendors that meet our inclusion criteria but did not completely participate in our Buyers Guide were assessed solely on publicly available information. As this could have a significant impact on their classification and rating, we recommend additional scrutiny when evaluating those vendors.
Products Evaluated
|
Vendor |
Product Names |
Version |
Release |
Participation Status |
|
Acceldata |
Data Observability Cloud |
2.7.0 |
May 2023 |
Complete |
|
Collibra |
Data Intelligence Cloud, Data Quality & Observability |
2023.04 |
April 2023 |
None |
|
DataKitchen |
DataKitchen Platform (DataOps Automation; DataOps Observability, DataOps TestGen) |
1.1.275; 1.481; 0.2.0 |
July 2023 |
Partial |
|
IBM |
IBM Data Observability by Databand |
1.0.12 |
September 2022 |
None |
|
Monte Carlo |
Monte Carlo Data Observability Platform |
June 30 |
June 2023 |
Complete |
|
Precisely |
Precisely Data Integrity Suite - Data Observability |
2023 July |
July 2023 |
None |
|
Stonebranch |
Universal Automation Center |
7.4 |
May 2023 |
None |
Vendors of Note
There is a very large and growing number of vendors in the DataOps software segment. We did not include vendors that, as a result of our research and analysis, did not satisfy the criteria for inclusion in the Buyer’s Guide.
Most of the vendors that did not meet our inclusion criteria were excluded based on size (either revenue and/or number of employees). Inclusion criteria validation was completed to the best of our ability using information publicly available or through our research.
Other vendors were excluded based on product suitability: either their products only addressed the orchestration or observability of data stored in a data platform rather than all upstream and downstream stages of a data pipeline, or at the time of evaluation they did not have a generally available product marketed as a tool or platform for data pipeline development, data orchestration or data observability (although some subsequently now do). Others were excluded based on having no published documentation, making it impossible to evaluate the capabilities of the product.
We did not include vendors that, as a result of our research and analysis, did not satisfy the criteria for inclusion in the Buyers Guide. These are listed below as “Vendors of Note.”
|
Vendor |
Product |
At least |
At least 75 employees |
Product suitability |
Documentation |
|
Anomalo |
Anomalo |
No |
No |
Yes |
Yes |
|
Ascend |
Ascend Data Automation Cloud |
No |
No |
Yes |
Yes |
|
Ataccama |
Ataccama ONE |
Yes |
Yes |
No |
Yes |
|
Bigeye |
Bigeye |
No |
No |
Yes |
Yes |
|
Data Culpa |
Data Culpa Validator |
No |
No |
Yes |
Yes |
|
Datafold |
Datafold |
No |
No |
Yes |
Yes |
|
DataOps.live |
Dataops.live |
No |
No |
Yes |
Yes |
|
Datorios |
Datorios |
No |
No |
Yes |
Yes |
|
DQLabs |
DQLabs Platform |
No |
No |
Yes |
Yes |
|
Elementl |
Dagster |
No |
No |
Yes |
Yes |
|
FirstEigen |
DataBuck |
No |
No |
Yes |
Yes |
|
Great Expectations |
Great Expectations |
No |
No |
Yes |
Yes |
|
Informatica |
Informatica Intelligent Data Management Cloud |
Yes |
Yes |
No |
Yes |
|
Integrate.io |
Data Observability |
No |
No |
No |
Yes |
|
Kensu |
Kensu |
No |
No |
Yes |
Yes |
|
Lightup |
Lightup |
No |
No |
Yes |
Yes |
|
Masthead |
Masthead |
No |
No |
Yes |
Yes |
|
Meltano |
Meltano |
No |
No |
Yes |
Yes |
|
Metaplane |
Metaplane |
No |
No |
Yes |
Yes |
|
Mozart Data |
Mozart Data |
No |
No |
Yes |
Yes |
|
Nexla |
Nexla |
No |
No |
Yes |
Yes |
|
Palantir |
Foundry |
Yes |
Yes |
No |
Yes |
|
RightData |
Dextrus, RDt |
No |
No |
Yes |
Yes |
|
Saturam |
Qualdo, Piperr |
No |
Yes |
Yes |
No |
|
Shipyard |
Shipyard |
No |
No |
Yes |
Yes |
|
Sifflet |
Sifflet |
No |
No |
Yes |
Yes |
|
Soda |
Soda Team, Soda Enterprise |
No |
No |
Yes |
Yes |
|
Talend |
Talend Data Fabric |
Yes |
Yes |
No |
Yes |
|
Telm.ai |
Telm.ai |
No |
No |
Yes |
Yes |
|
Torana |
iceDQ |
No |
Yes |
Yes |
No |
|
Validio |
Validio |
No |
No |
Yes |
Yes |
About Ventana Research
Ventana Research is the most authoritative and respected benchmark business technology research and advisory services firm. We provide insight and expert guidance on mainstream and disruptive technologies through a unique set of research-based offerings including Benchmark Research and technology evaluation assessments, education workshops and our research and advisory services, Ventana On-Demand. Our unparalleled understanding of the role of technology in optimizing business processes and performance and our best practices guidance are rooted in our rigorous research-based benchmarking of people, processes, information and technology across business and IT functions in every industry. This Benchmark Research plus our market coverage and in-depth knowledge of hundreds of technology providers means we can deliver education and expertise to our clients to increase the value they derive from technology investments while reducing time, cost and risk.
Ventana Research provides the most comprehensive analyst and research coverage in the industry; business and IT professionals worldwide are members of our community and benefit from Ventana Research’s insights, as do highly regarded media and association partners around the globe. Our views and analyses are distributed daily through blogs and social media channels including Twitter, Facebook and LinkedIn.
To learn how Ventana Research advances the maturity of organizations’ use of information and technology through benchmark research, education and advisory services, visit www.ventanaresearch.com.
What We Offer
Ventana Research provides a variety of customizable services to meet your specific needs including workshops, assessments and advisory services. Our education service, led by analysts with more than 20 years of experience, provides a great starting point to learn about important business and technology topics from compliance to BI to building a strategy and driving adoption of best practices. We also offer tailored Value Index Assessment Services to help you define your strategy, build a business case and connect the business and technology phases of your project. And we provide Ventana On-Demand (VOD) access to our analysts on an as-needed basis to help you keep up with market trends, technologies and best practices.
Everything at Ventana Research begins with our focused research, of which this Value Index is a part. We work with thousands of organizations worldwide, conducting research and analyzing market trends, best practices and technologies to help our clients improve the efficiency and effectiveness of their organizations. Through the Ventana Research community we also provide opportunities for professionals to share challenges, best practices and methodologies. Sign up for Individual membership at https://www.ventanaresearch.com/ to gain access to our weekly insights and learn about upcoming educational and collaboration events, including webinars, conferences and opportunities for social collaboration on the Internet.
We offer the following membership levels for business and IT professionals:
Individual membership: For business and IT professionals interested in full access to our website and analysts for themselves. The membership includes access to our library of hundreds of white papers and research notes, briefings, and telephone or email consulting sessions to provide input and feedback.
Team membership: For business and IT professionals interested in full access to our website and analysts for a five-member team. The membership includes access to our library of hundreds of white papers and research notes, briefings, telephone or email consulting sessions to provide input and feedback, and use of Ventana Research materials for business purposes.
Business membership: For business and IT professionals interested in full access to our website and analysts for their larger team or small business unit. The membership includes access to our library of hundreds of white papers and research notes, briefings, telephone or email consulting sessions to provide input and feedback, use of Ventana Research materials for business purposes, and additional analyst availability.
Business Plus membership: For business and IT professionals interested in full access to our website and analysts for larger numbers of company employees. The membership includes access to our library of hundreds of white papers and research notes, briefings, telephone or email consulting sessions to provide input and feedback, quotes and validation for media, use of Ventana Research materials for business purposes, additional analyst availability, and access to our team for scheduled strategy consulting sessions
Additional services are available for solution providers, software vendors, consultants and systems integrators.
This Value Index report is one of a series that are available for purchase. Also available are any of our extensive library of Benchmark Research reports. To purchase a report or learn more about Ventana Research services—including workshops, assessments and advice—please contact sales@ventanaresearch.com.
|
© 2023 VentanaResearch. Reproduction or distribution of this research in any form without prior written permission is forbidden. The research is based on information obtained from sources believed to be reliable, which can include communications from the technology supplier and information made available publicly on the Internet. Ventana Research is not liable for any inaccuracies in the information supplied. |
